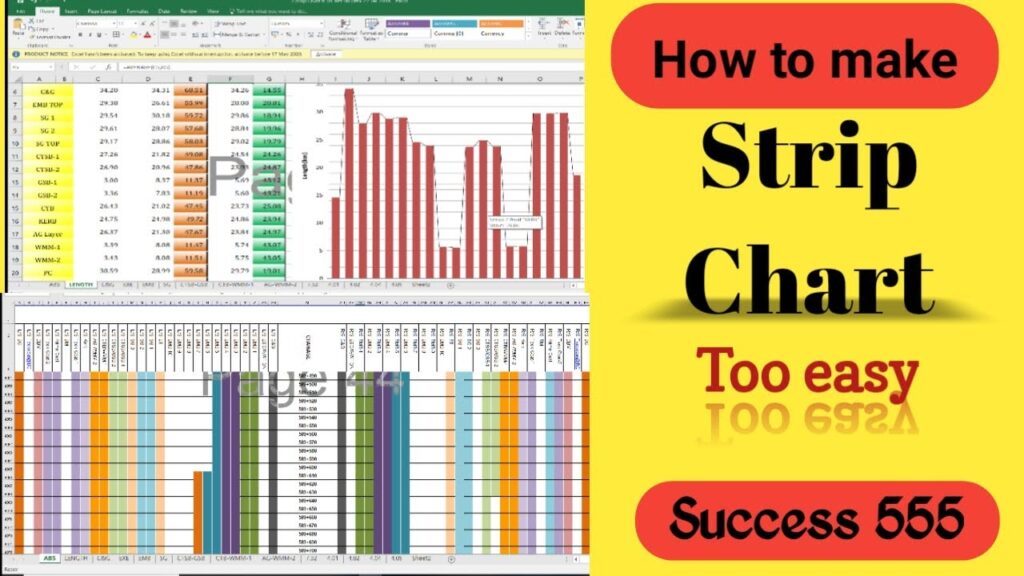
A strip chart, also known as a strip recorder, is a powerful and versatile tool used for recording data over time. This type of data visualization and recording method has been widely used across various industries, including engineering, science, and healthcare, due to its ability to provide continuous monitoring and a clear representation of trends. In this article, we will delve into the intricacies of strip charts, their applications, benefits, and the technology behind them.
What is a Strip Chart?
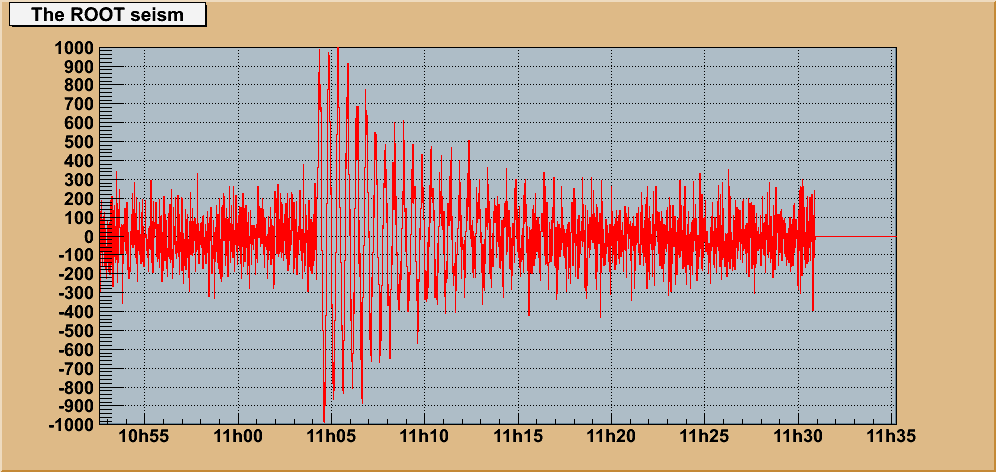
A strip chart is a type of chart or graph that records data points continuously over time on a long strip of paper or its digital equivalent. These charts are typically used to monitor changes in variables, such as temperature, pressure, or voltage, over a specific period. Strip charts can display single or multiple variables simultaneously, making them highly valuable in scenarios where real-time data tracking is essential.
Components of a Strip Chart Recorder
Traditional strip chart recorders consist of the following components:
- Paper Chart: A continuous roll of paper where data is recorded.
- Recording Mechanism: A pen or stylus that marks data on the chart.
- Drive System: A mechanism that moves the paper at a predetermined speed to ensure accurate time representation.
- Input Signal: The data source, often an electrical signal, that the recorder translates into visual data.
Modern digital strip chart recorders have replaced paper and pen with digital displays and data storage systems. These electronic versions offer advanced features such as data export, integration with other devices, and customizable display options.
Applications of Strip Charts
Strip charts have a wide range of applications across different fields. Here are some common uses:
1. Healthcare:
- Electrocardiograms (ECG): Strip charts are used to record the electrical activity of the heart over time, helping diagnose heart conditions.
- Fetal Monitoring: Continuous monitoring of fetal heart rates during labor.
2. Engineering and Industry:
- Process Control: Monitoring temperature, pressure, and other variables in industrial processes.
- Equipment Testing: Recording performance metrics of machinery over time.
3. Environmental Monitoring:
- Weather Stations: Tracking changes in atmospheric conditions like temperature, humidity, and pressure.
- Pollution Monitoring: Measuring pollutant levels in air or water over time.
4. Scientific Research:
- Data Collection: Observing and recording experimental data continuously.
- Behavioral Studies: Monitoring variables like response times or physiological changes in subjects.
Advantages of Strip Charts
Strip charts offer numerous benefits that make them indispensable in many fields:
- Continuous Monitoring: They provide real-time tracking of data, which is crucial for dynamic systems.
- Trend Analysis: By visualizing data over time, strip charts make it easy to identify patterns and trends.
- Simplicity: The straightforward nature of strip charts allows for easy interpretation and troubleshooting.
- Historical Record: They serve as a permanent record of data for future reference and analysis.
- Versatility: Suitable for both analog and digital data sources, strip charts adapt to a variety of applications.
Limitations of Strip Charts
Despite their advantages, strip charts also have certain limitations:
- Limited Resolution: Paper-based charts can have resolution constraints compared to digital data storage.
- Space Requirements: Traditional recorders require physical storage for paper rolls, which can be cumbersome.
- Maintenance: Mechanical parts in traditional systems require regular upkeep.
- Data Analysis: Manual analysis of paper charts can be time-consuming compared to digital tools.
Transition to Digital Strip Charts
The advent of digital technology has revolutionized strip chart recording. Digital strip chart recorders offer several advancements:
- Data Storage: Digital systems store large volumes of data without the need for physical space.
- Enhanced Accuracy: Digital recorders provide higher precision and eliminate mechanical errors.
- Ease of Sharing: Data can be exported and shared easily for collaborative analysis.
- Integration: Modern recorders can integrate with other monitoring systems and IoT devices.
- Customization: Users can tailor displays and settings to suit specific monitoring needs.
How to Choose the Right Strip Chart Recorder
When selecting a strip chart recorder, consider the following factors:
- Data Type: Determine whether the data is analog or digital and the number of variables to be recorded.
- Time Scale: Consider the time frame over which data will be monitored.
- Accuracy Requirements: Choose a recorder with the necessary precision for your application.
- Environment: Ensure the recorder can withstand the conditions of the monitoring environment.
- Ease of Use: Opt for a system with user-friendly controls and interfaces.
Tips for Effective Use of Strip Charts
To get the most out of a strip chart recorder, follow these best practices:
- Regular Calibration: Ensure the system is calibrated periodically to maintain accuracy.
- Proper Maintenance: Keep the recorder clean and replace worn components as needed.
- Analyze Data Promptly: Regularly review and analyze data to address issues in real-time.
- Backup Digital Data: For digital recorders, create backups to prevent data loss.
The Future of Strip Charts
As technology advances, the role of strip charts continues to evolve. Emerging trends include:
- Integration with AI: Predictive analytics and anomaly detection powered by AI.
- Cloud Connectivity: Remote monitoring and data access through cloud-based platforms.
- Improved Portability: Compact, lightweight devices for field applications.
- Eco-Friendly Designs: Reduced use of paper and other non-renewable resources.
Conclusion:
Strip charts remain a vital tool for continuous data monitoring and trend analysis. Whether in traditional paper-based formats or modern digital versions, they provide invaluable insights across various industries. By understanding their applications, benefits, and technological advancements, users can harness the full potential of strip charts to enhance decision-making and optimize processes.


